Forex Correlation Pairs Trading: Complete Strategy Guide for 2026
Unlock profitable forex insights with correlation pairs trading. Learn the strategy, calculate correlation, and diversify risk.

Understanding Forex Correlation: What It Is and Why It Matters
Around major market events, something interesting happens in the forex market. EUR/USD and GBP/USD, two pairs that typically move in lockstep with a correlation above 0.85, can suddenly diverge — one climbs while the other falls — before snapping back into line.
Retail traders don't notice. They're too busy drawing trend lines.
But on institutional desks, these dislocations get watched closely, because correlation isn't a risk to avoid, it's a signal to read.
Here's the reality: many consistently profitable traders treat correlation-based analysis as a core part of their process. Meanwhile, the vast majority of failing traders have never calculated a correlation coefficient in their lives.
The textbook definition of forex correlation is simple enough: a statistical measure of how two currency pairs move in relation to each other. Positive correlation means they move together. Negative correlation means they move opposite. A correlation coefficient of +1 means perfect positive correlation; -1 means perfect negative correlation; 0 means no correlation. If you are new to funded trading, here is how prop firm funding works.
But here's what the textbooks miss: correlation is dynamic, not static.
Calculating Forex Correlation: A Step-by-Step Guide
Understanding forex correlation pairs trading strategy starts with mastering the calculation process. The EUR/USD and GBP/USD correlation isn't always 0.85. During NFP releases, it can spike to 0.95. During Brexit headlines, it can plummet to 0.30. During Asian sessions, it hovers around 0.75. These aren't random fluctuations. They're tradeable patterns.
At Institutional Trading Academy, we track correlation coefficients across 28 major pairs in real-time. Not because we're avoiding risk. We're hunting opportunity. When correlations break their normal ranges, institutional money is moving. Where institutional money moves, retail traders should follow.
But first, you need to understand the mathematics.
Calculating correlation requires more than eyeballing two charts. The Pearson correlation coefficient formula is:
r = Σ[(xi, x̄)(yi, ȳ)] / √[Σ(xi, x̄)² × Σ(yi, ȳ)²]
Where xi and yi are individual price points, and x̄ and ȳ are the means. This formula might seem intimidating. However, understanding it is absolutely necessary for implementing a forex correlation pairs trading strategy effectively.
Top Correlated Forex Pairs and How to Trade Them
Understanding forex correlation pairs trading strategy starts with recognizing which currency pairs move together. The most correlated forex pairs provide systematic opportunities when you know how to identify and trade them effectively.
Modern platforms make correlation calculation straightforward. Match Trader's correlation indicator updates in real-time. TradingView's correlation coefficient tool lets you overlay any two instruments. Even Excel can calculate rolling correlations with a simple CORREL function. The tools are free. The edge comes from knowing how to use them.
Major correlated forex pairs include:
- EUR/USD and GBP/USD (positive correlation typically 0.70-0.90)
- AUD/USD and NZD/USD (positive correlation typically 0.80-0.95)
- USD/JPY and USD/CHF (positive correlation typically 0.60-0.80)
- EUR/USD and USD/CHF (negative correlation typically -0.80 to -0.95)
The most profitable correlation trades extend beyond obvious pairs. Professional traders monitor second-order correlations. USD/JPY correlates with US equity indices. EUR/CHF moves with European banking stocks. GBP/AUD tracks copper futures. These correlations aren't in retail trading books because they require thinking beyond forex.
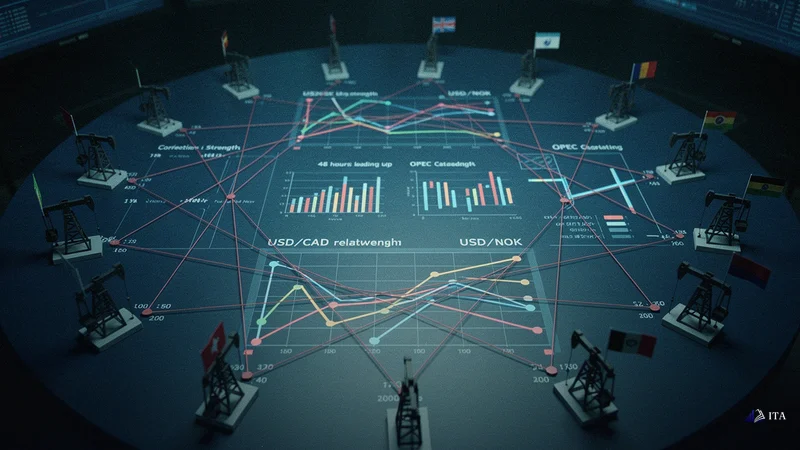
Consider the USD/CAD and WTI crude oil relationship. The correlation typically runs at -0.75 to -0.85 according to historical data. When oil rises, CAD strengthens, USD/CAD falls. This relationship creates higher-probability trading opportunities during oil market volatility.

Forex Correlation Trading Strategies: A Practical Approach
But watch what happens during OPEC meetings. In the 48 hours before an announcement, this correlation weakens to -0.40 as uncertainty builds. Smart money positions for mean reversion. When OPEC speaks, correlation snaps back violently. The trade isn't in oil or USD/CAD individually, it's in the correlation returning to normal.
This brings us to the three correlation strategies that actually work.
First, correlation hedging, but not how retail traders do it. Retail hedging means opening opposite positions in correlated pairs, guaranteeing small losses through spread costs. Institutional hedging means opening positions in negatively correlated pairs during specific market conditions. Long EUR/USD and long USD/CHF isn't hedging, it's paying double spread to go nowhere. Long EUR/USD and long USD/CHF when their correlation drops below -0.60 is statistical arbitrage.
Second, correlation divergence trading. When two normally correlated pairs diverge beyond two standard deviations, probability favours convergence. The key word is "normally." EUR/USD and GBP/USD diverging during Brexit isn't a correlation trade, it's a fundamental shift. EUR/USD and GBP/USD diverging during quiet Asian sessions? That's opportunity.
Third, portfolio correlation optimisation. This is where retail traders fail completely. They'll hold long EUR/USD, long GBP/USD, long AUD/USD, and short USD/JPY, thinking they have four trades. They have one trade: short USD. When the dollar strengthens, all four positions lose. Proper correlation analysis would show their portfolio correlation is above 0.90, they're quadrupling risk, not diversifying it. New to the model? Here is what a prop firm in forex actually is.
At ITA, we teach correlation from day one.

Common Mistakes to Avoid When Trading Forex Correlations
Our funded traders don't just check correlation before entering trades; they build entire strategies around correlation cycles. They know that EUR/GBP correlation with oil peaks during London-New York overlap. They track when gold-USD correlation inverts during Federal Reserve weeks. They understand that correlation isn't a static number, it's a living, breathing market dynamic.
But knowing correlation patterns isn't enough. You need to avoid the three mistakes that destroy correlation traders.
First, ignoring market regime changes. Correlations that held for years can break overnight. The Swiss National Bank removing the EUR/CHF peg in 2015 shattered correlations across European pairs. Traders using historical correlation data got massacred. Always confirm correlations are holding before trading them.
Second, over-leveraging correlation trades. Because correlation trades feel "safe," traders size up. When EUR/USD and GBP/USD correlate at 0.90, betting on convergence seems guaranteed. Until Brexit vote night, when correlation went negative for the first time in decades. Size correlation trades like any other trade, because that's what they are.
Third, confusing correlation with causation. EUR/USD and GBP/USD don't move together because they're mystically linked. They move together because they share USD exposure and similar European fundamentals. When those fundamentals diverge, like during country-specific data releases, correlation breaks. Understanding why correlations exist helps predict when they'll fail. If you are choosing where to get funded, see our take on the best forex prop firm for 2026.
The institutional edge comes from synthesis.
How Forex Correlation Aligns with ITA's Risk Management
Retail traders use correlation defensively, avoiding correlated positions to reduce risk. Institutional traders use correlation offensively, hunting correlation breaks for profit. The difference is perspective.
At ITA, our risk management framework incorporates real-time correlation monitoring. Not to avoid correlated positions, to size them appropriately. If you're long EUR/USD with a 2% risk and want to long GBP/USD, you don't need to skip the trade. You need to adjust position size based on correlation. At 0.90 correlation, that second position might warrant 0.5% risk. At 0.30 correlation, maybe 1.5%. The correlation coefficient becomes a position sizing input.
This is how funded traders think. Not "can I take this trade?" but "what size should this trade be given my current portfolio correlations?"
The mathematics are straightforward. If you have two positions with correlation r, your portfolio variance is:
σ² = w₁²σ₁² + w₂²σ₂² + 2w₁w₂σ₁σ₂r
Where w represents position weights and σ represents volatility. Higher correlation means higher portfolio variance means higher risk. Adjust weights accordingly.

Frequently Asked Questions About Forex Correlation
But here's the masterclass insight.
The best correlation trades happen when correlations break at specific times. EUR/USD and USD/CHF typically correlate at around -0.95. Around major ECB announcements, that relationship can loosen temporarily as traders position for Euro-specific news, then tighten again afterward.
Some traders watch for exactly these dislocations: when the usual correlation loosens, they look for opposite positions in the two pairs to trade the eventual reconvergence. You're not betting on ECB direction, you're betting on correlation returning to normal. Win or lose on the news, correlation convergence provides edge.
This is correlation trading at institutional level. Not avoiding risk, manufacturing edge from statistical probability.
The question isn't whether you should use correlation in your trading. The question is whether you'll use it defensively like retail traders or offensively like professionals. Because in modern forex markets, correlation isn't just a risk metric, it's a profit engine waiting to be started.
At ITA, we've built our entire risk framework around dynamic correlation monitoring. Our traders don't just survive correlation shifts, they profit from them. Because when you understand that correlation breaks are signals, not risks, you stop fearing correlation and start trading it.
Next Steps: Implementing Forex Correlation in Your Trading Plan
The choice is yours. Keep drawing trend lines and hoping. Or start calculating correlations and knowing.
The institutions have already chosen. The only question is: when will you?
Frequently Asked Questions
What is forex correlation and how does it work?
Forex correlation is a statistical measure of how two currency pairs move in relation to each other, expressed as a coefficient between -1 and +1. Positive correlation means pairs move together, negative correlation means they move opposite. For example, EUR/USD and GBP/USD typically correlate at 0.85, moving in the same direction 85% of the time.
How do you calculate correlation between forex pairs?
Correlation is calculated using the Pearson correlation coefficient formula, comparing price movements over a specific period. Most trading platforms like Match Trader and TradingView provide built-in correlation tools that update in real-time. The coefficient ranges from -1 (perfect negative correlation) to +1 (perfect positive correlation), with 0 indicating no correlation.
Which forex pairs have the strongest correlations?
EUR/USD and GBP/USD typically show the strongest positive correlation at 0.85-0.90, while USD/CHF and EUR/USD demonstrate a strong negative correlation, often around -0.95. Other highly correlated pairs include AUD/USD and NZD/USD (positive), and USD/CAD with oil prices (negative correlation of -0.75 to -0.85).
What are the biggest mistakes in forex correlation trading?
The three critical mistakes are ignoring market regime changes (correlations can break overnight during major events), over-leveraging correlation trades because they feel safer, and confusing correlation with causation. Traders also fail to adjust position sizes based on portfolio correlation, effectively taking the same trade multiple times without realising it.
How can correlation trading improve risk management?
Correlation analysis prevents portfolio concentration by identifying when multiple positions are essentially the same trade. Instead of avoiding correlated pairs, professional traders adjust position sizes based on correlation coefficients. At 0.90 correlation, a second position might warrant 0.5% risk instead of 2%, maintaining proper portfolio variance and risk distribution.

Key Takeaways
- Calculate correlation coefficients using the Pearson formula to identify tradeable patterns when pairs diverge beyond normal ranges.
- Monitor second-order correlations like USD/JPY with equity indices — these generate more profit than obvious EUR/USD-GBP/USD pairs.
- Watch for correlation breaks during major events: pairs like EUR/USD and USD/CHF can loosen from their usual relationship around ECB announcements, then tighten again.
- Size positions based on portfolio correlation using variance formula — higher correlation requires smaller position weights to manage risk.
- Avoid over-leveraging correlation trades even when they feel safe — correlation can break overnight during regime changes.
- Use correlation offensively for profit, not defensively for risk — hunt correlation divergences beyond two standard deviations for convergence trades.
- Track real-time correlation coefficients across 28 major pairs to identify when institutional money moves and retail should follow.
Start Your Trading Evaluation
Simulated funded accounts up to $800K. Up to 95% profit split.
Get Funded